The AptBite guide
Make the numbers easier to use.
Practical guides for reading Nutrition Facts labels and comparing packaged foods. No scores, no shortcuts—just the denominator, the math, and the trade-off.
Label basics
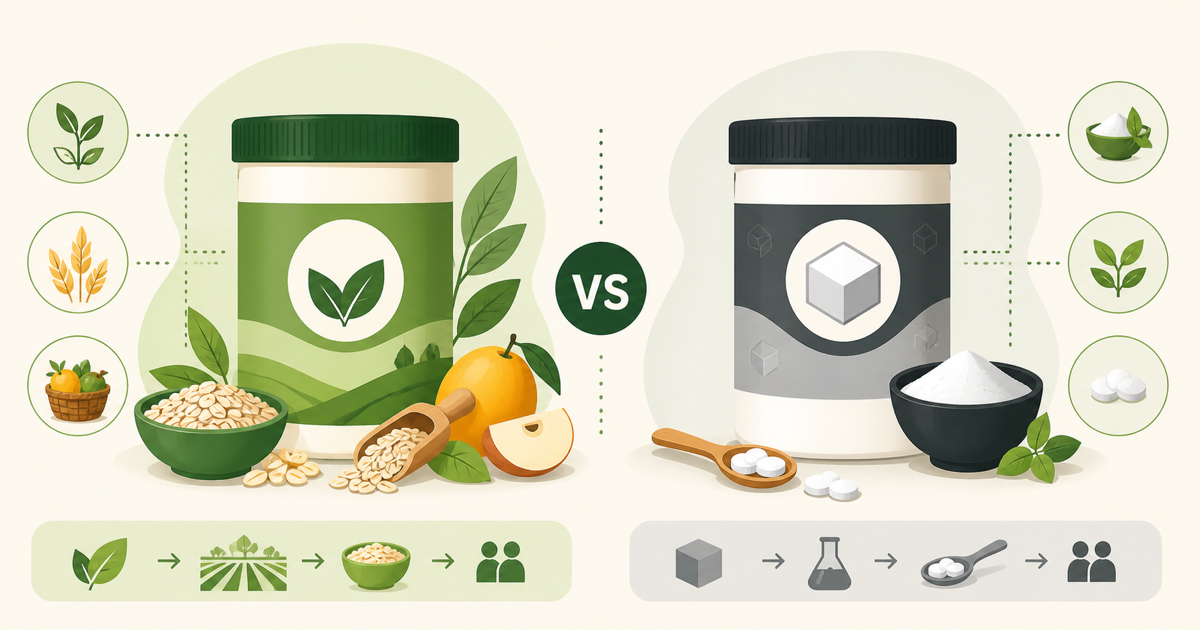
0g Added Sugar vs Sugar-Free
Sugar-free means under 0.5g of sugars per serving; 0g added sugar only means no sugar was added during processing. How to read both claims.
Read the guide →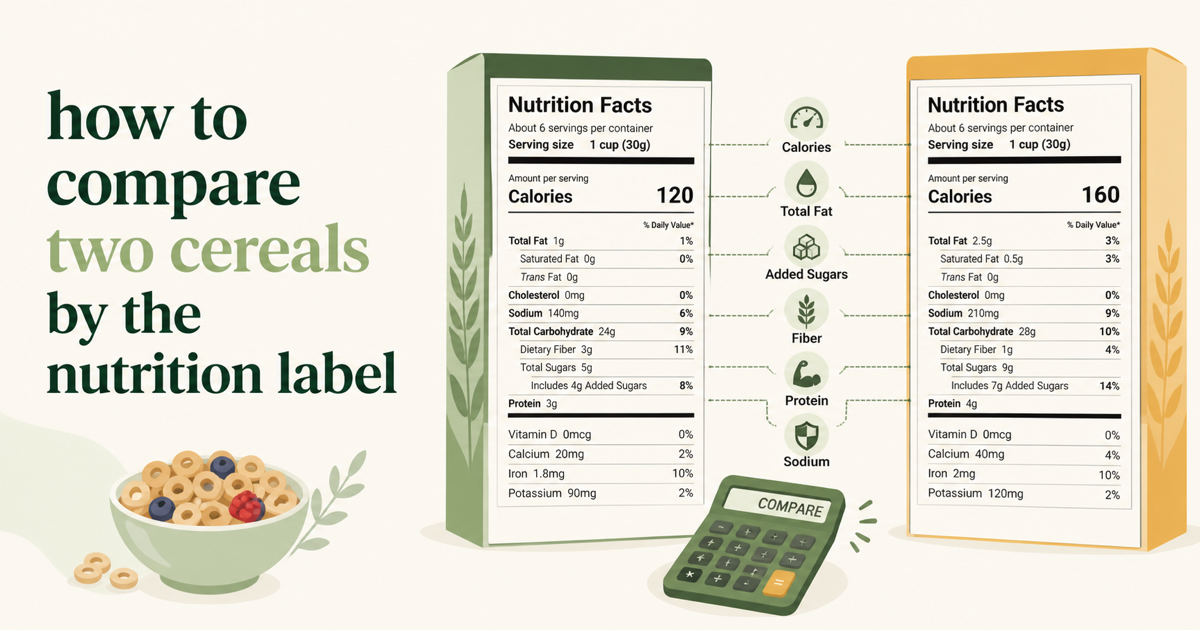
Shopping guide
A 60-Second Grocery Aisle Nutrition Checklist
A timed 60-second label check: serving size at 0–10s, calories at 10–25s, your target nutrient at 25–40s, added sugar at 40–50s, price at 50–60s.
Read the guide →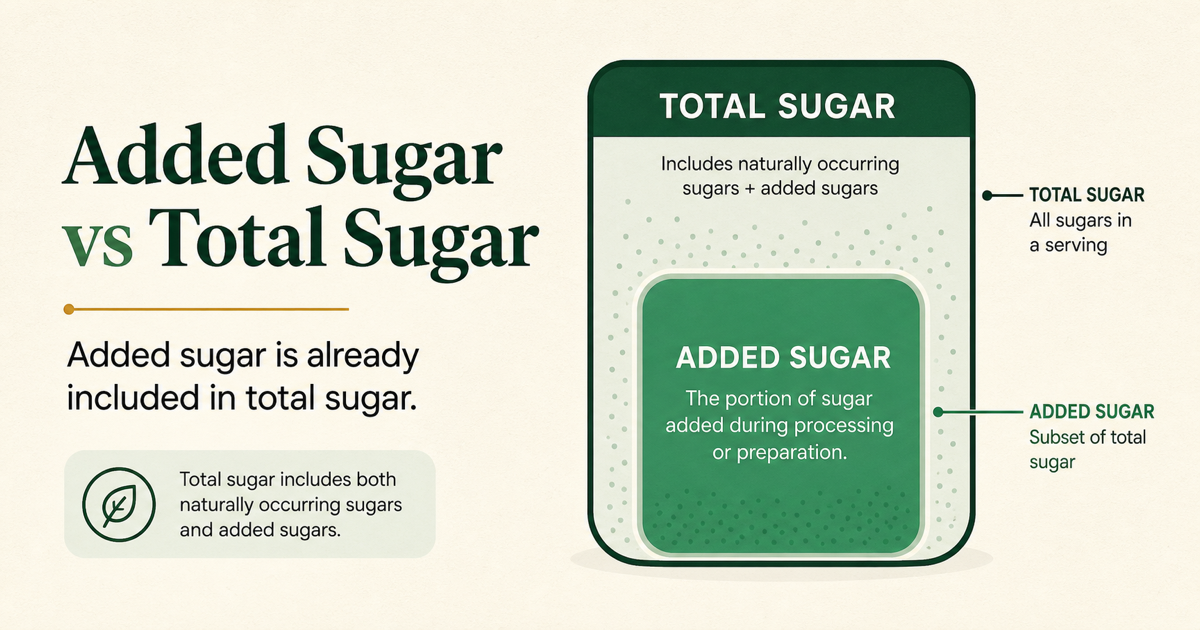
Label basics
Added Sugar vs Total Sugar: What’s the Difference?
Learn the difference between total sugar and added sugar, what “Includes Added Sugars” means, and how to compare two nutrition labels fairly.
Read the guide →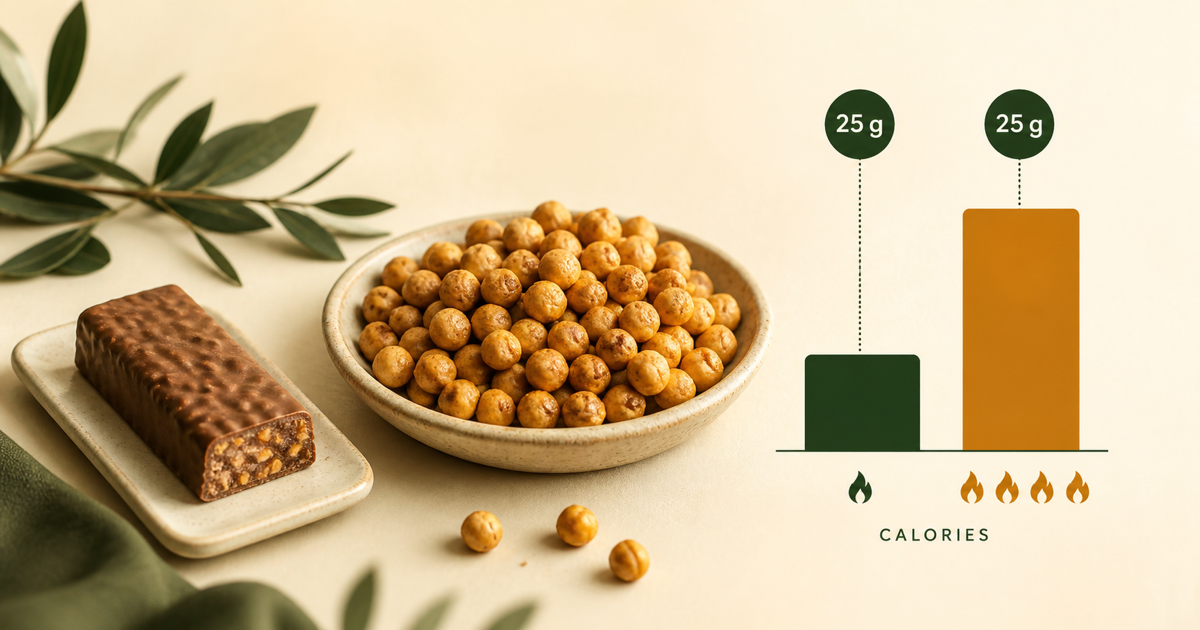
Tool guide
Calories per 25g Protein: Formula and Examples
Learn the calories-per-25g-protein formula, check worked food-label examples, understand rounding limits, or use AptBite's free calculator.
Read the guide →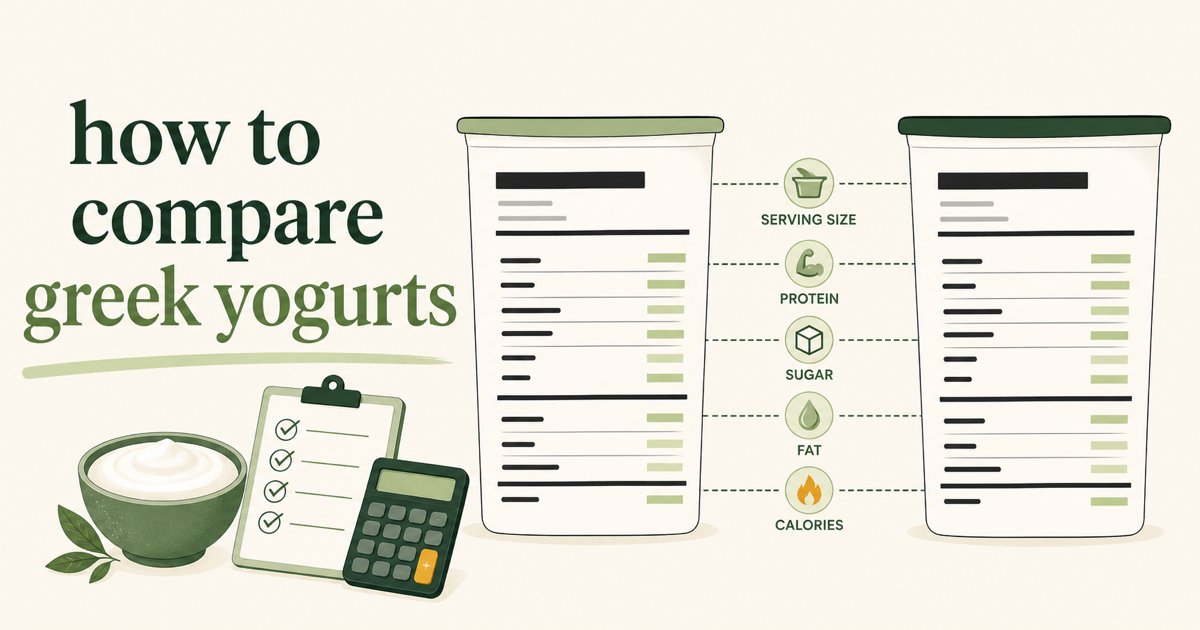
Label basics
Dual-Column Nutrition Labels Explained
Why some U.S. labels show per serving and per container columns: dual columns apply at 200%–300% of the reference amount; above 300% it is one serving.
Read the guide →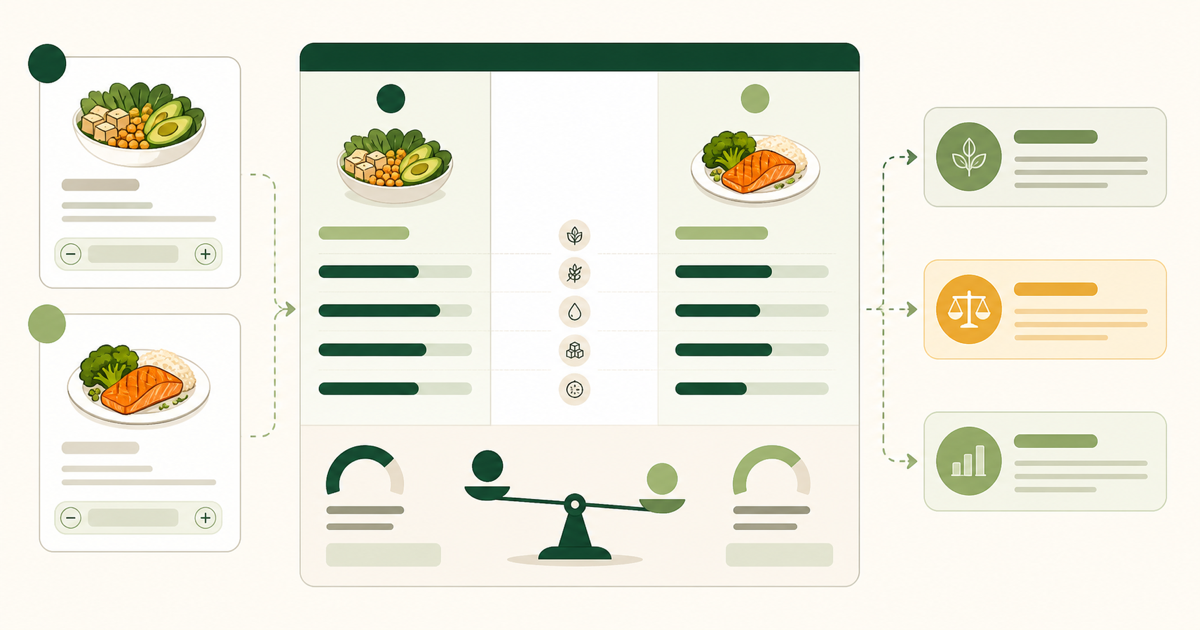
Tool guide
Food Comparison Calculator: How to Interpret the Result
How to read a food comparison result: check the basis, size the gap, apply the 2% tie test, and look for missing inputs before you decide.
Read the guide →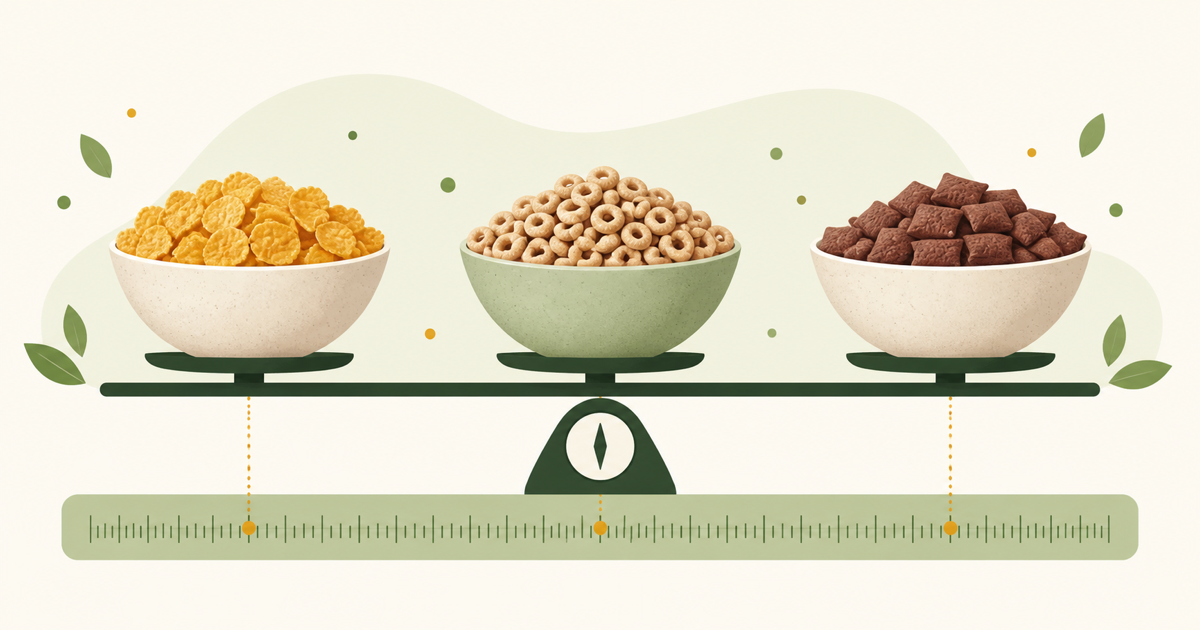
Shopping guide
How to Compare Breakfast Cereals
Cereal servings range from about 27g to 55g or more. Compare per 100g, check 'made with whole grain' claims, and read kids' cereal sugar in context.
Read the guide →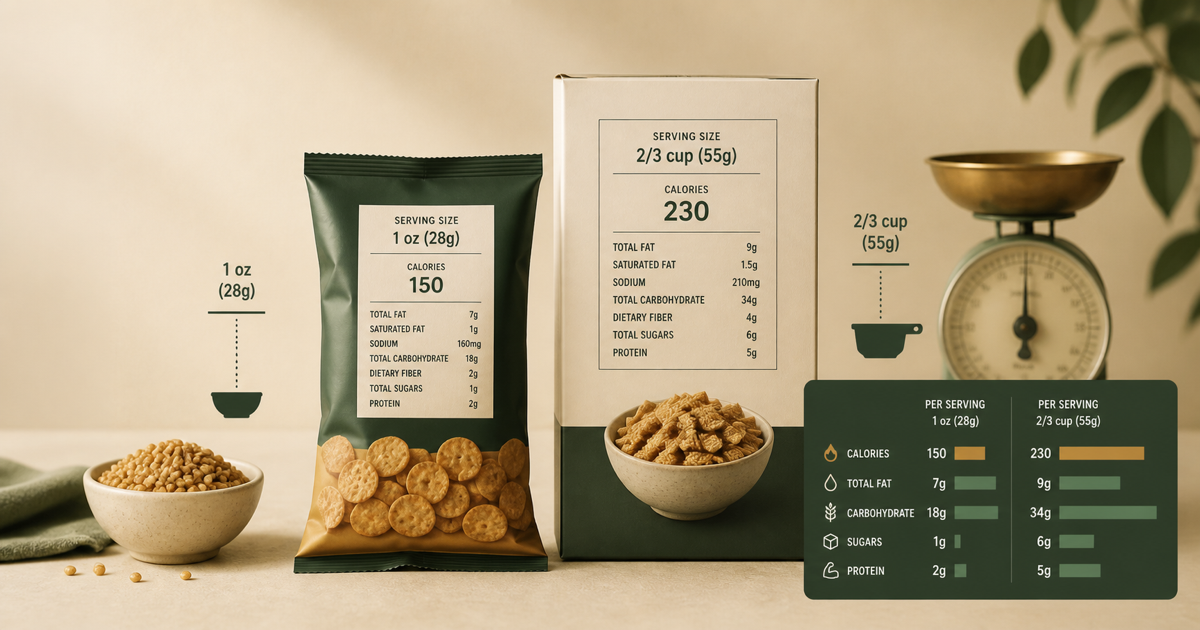
Label basics
How to Compare Foods with Different Serving Sizes
Three ways to compare foods with different serving sizes — per 100g, per 100 calories, per protein target — with formulas, examples, and a decision tree.
Read the guide →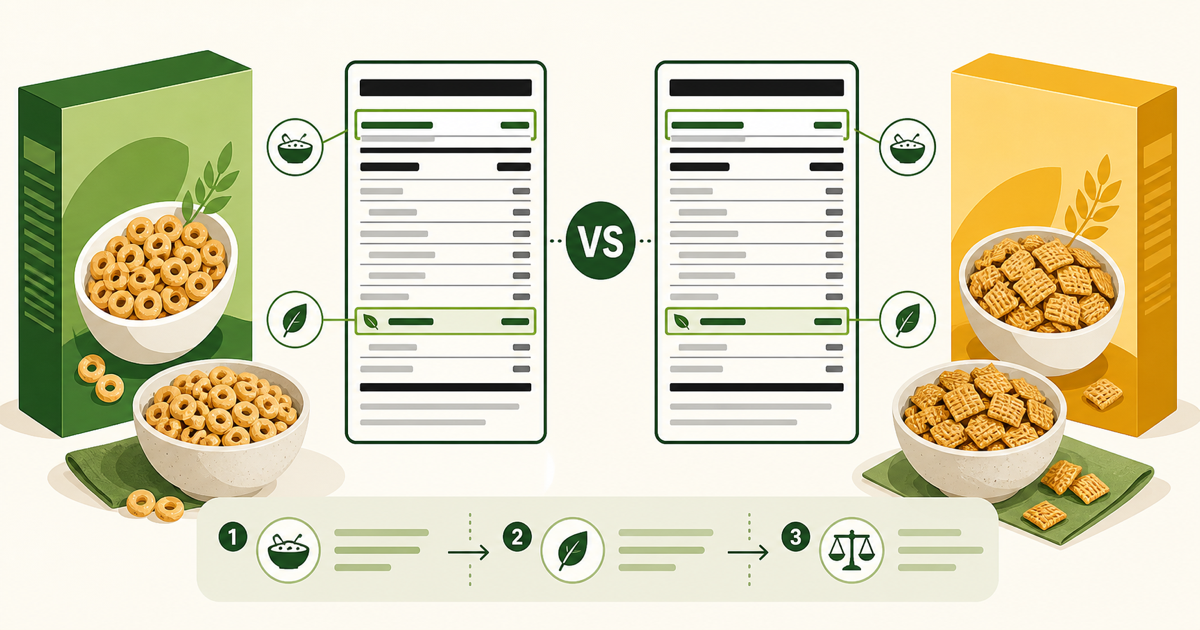
Shopping guide
How to Compare Granola and Breakfast Bars
Compare granola and breakfast bars by the portion you actually eat: granola servings are often 1/4–1/2 cup, and bars run from 25g snacks to 55g meal bars.
Read the guide →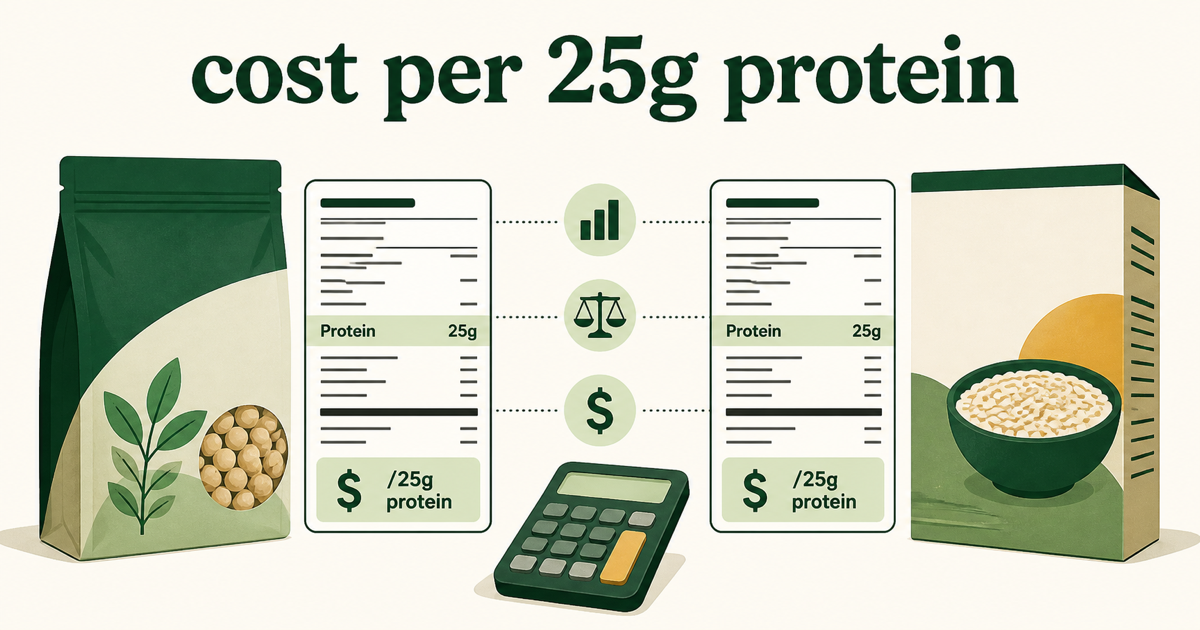
Shopping guide
How to Compare Greek Yogurt Labels
Compare Greek yogurts by the cup you finish: typical protein of 15–18g per 170g cup, true strained vs Greek-style, lactose vs added sugar, and price.
Read the guide →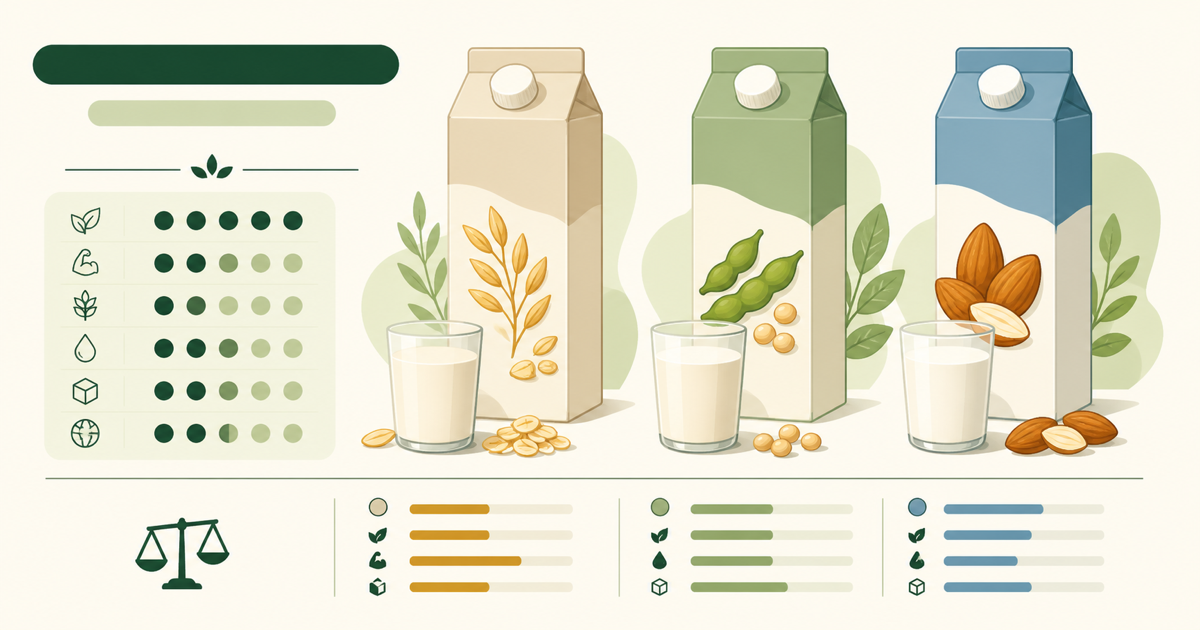
Shopping guide
How to Compare Plant-Based Milks
Soy, oat, and almond drinks are not interchangeable: roughly 7–9g protein per cup for soy vs about 1g for almond. Compare protein, sugars, and fortification.
Read the guide →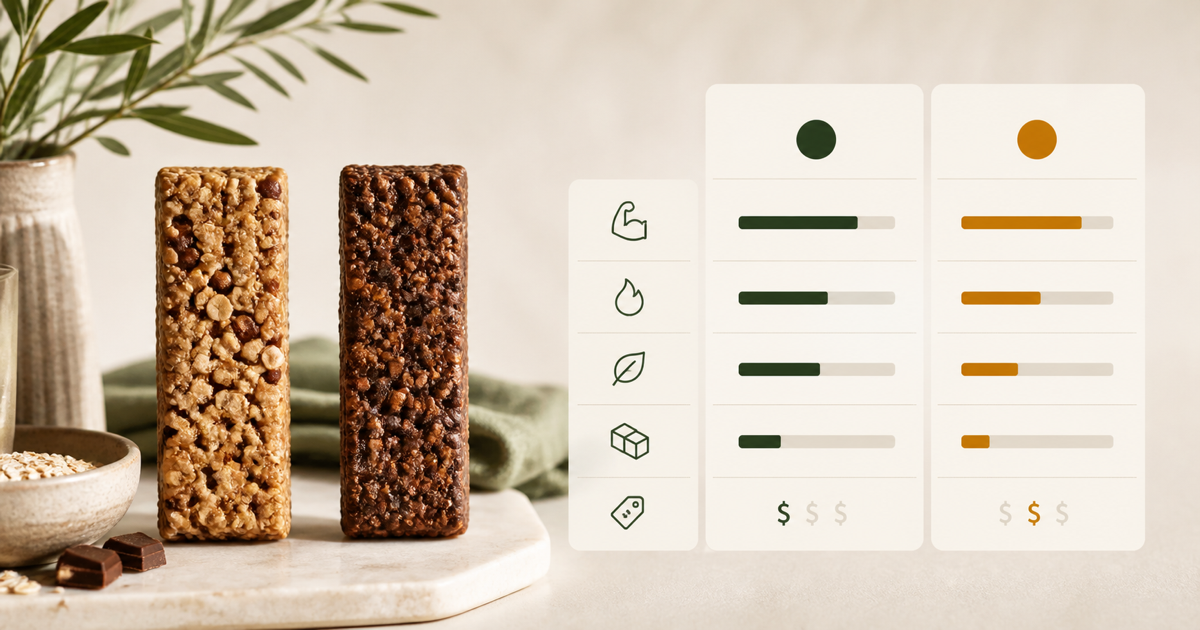
Shopping guide
How to Compare Protein Bars by the Label
Compare protein bars by serving count, protein density, added sugar, sugar alcohols, and price per 10g of protein — a label-first method from AptBite.
Read the guide →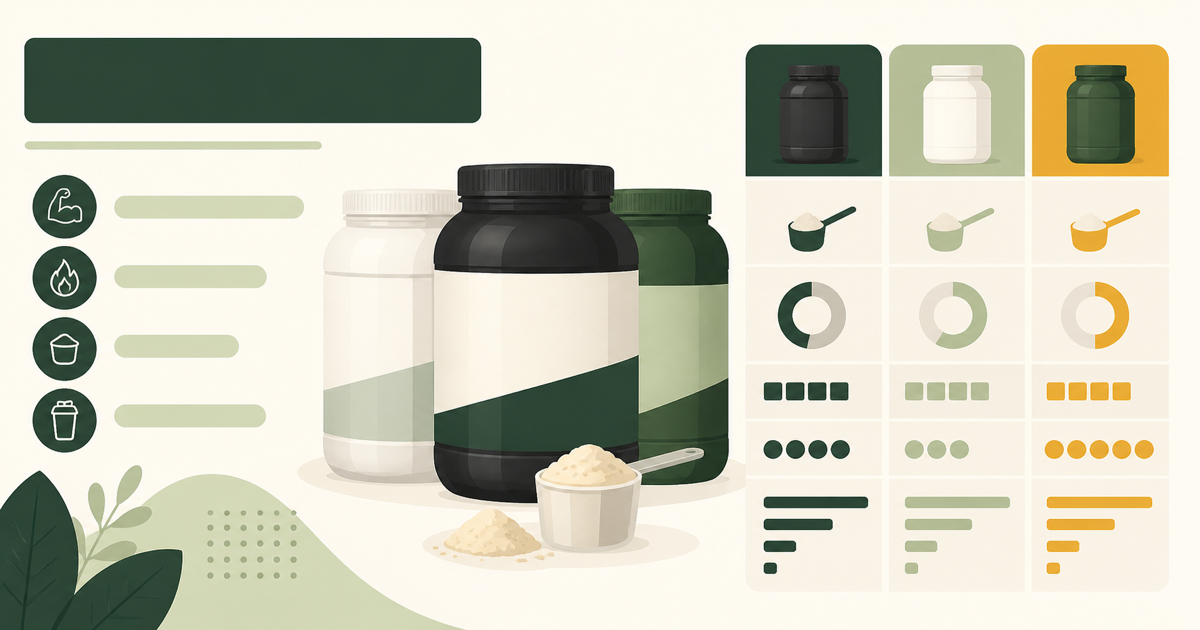
Shopping guide
How to Compare Protein Powders
Compare protein powders by protein per scoop (24g in a 30g scoop is 80%), isolate vs concentrate, amino spiking, and price per 25g of protein.
Read the guide →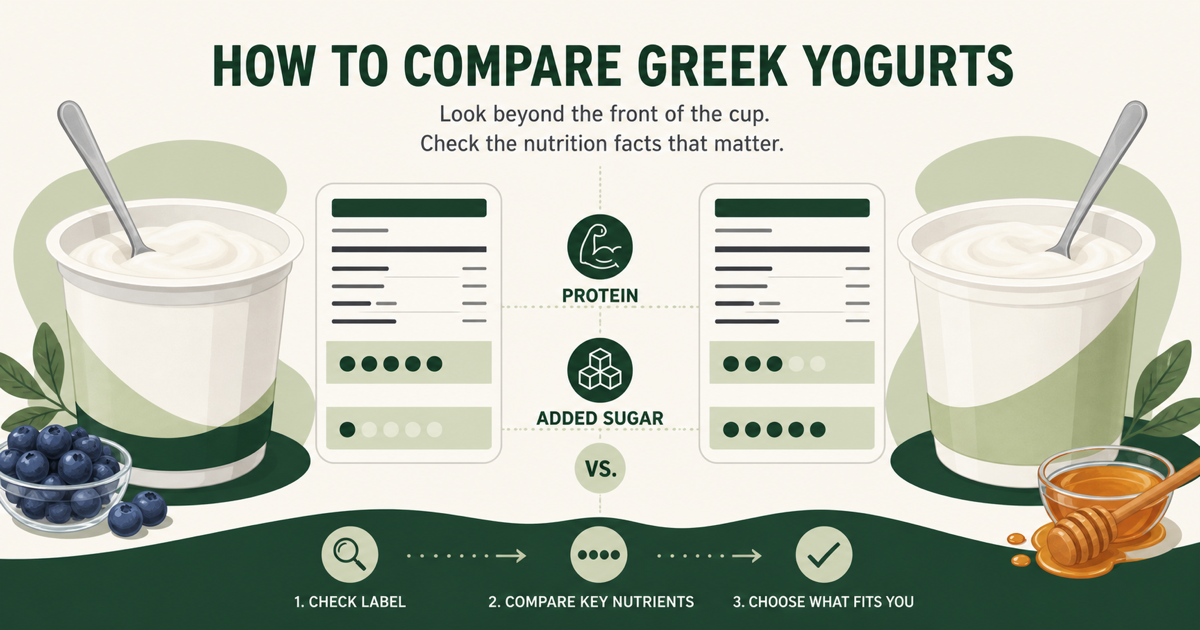
Shopping guide
How to Compare Protein Shakes
Compare protein shakes by the amount you will actually drink: whole-bottle protein and calories, added sugar, RTD vs powder, storage, and price.
Read the guide →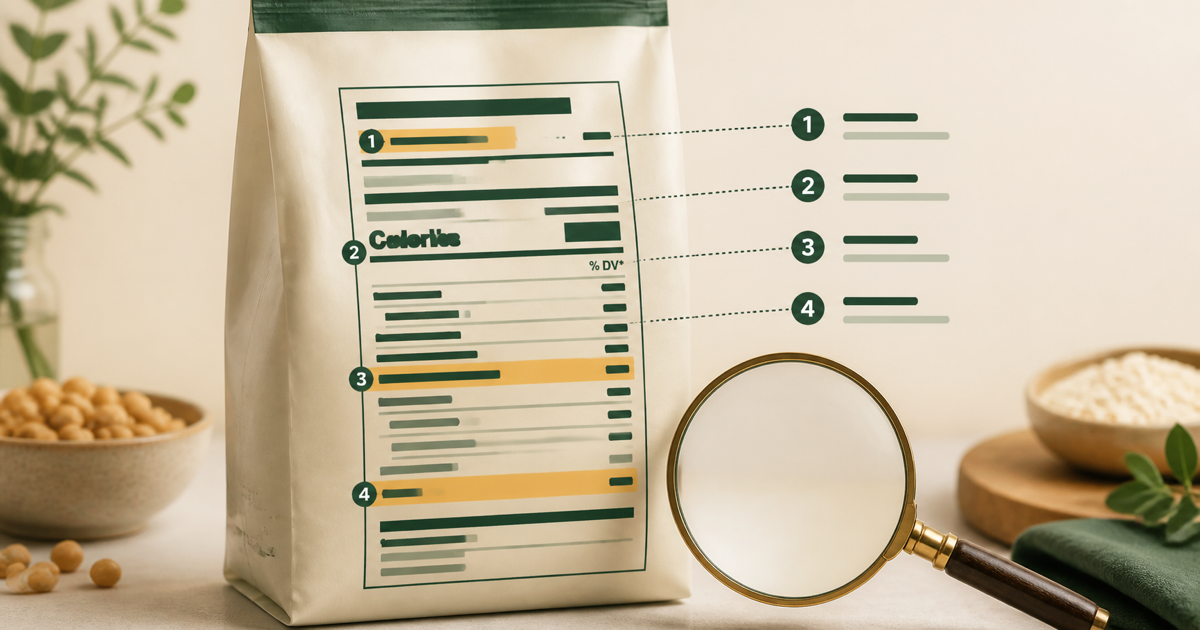
Label basics
How to Read a Nutrition Label Step by Step
Read a Nutrition Facts label with confidence: serving size first, then calories, nutrients, %DV, added sugar, and the context most shoppers miss.
Read the guide →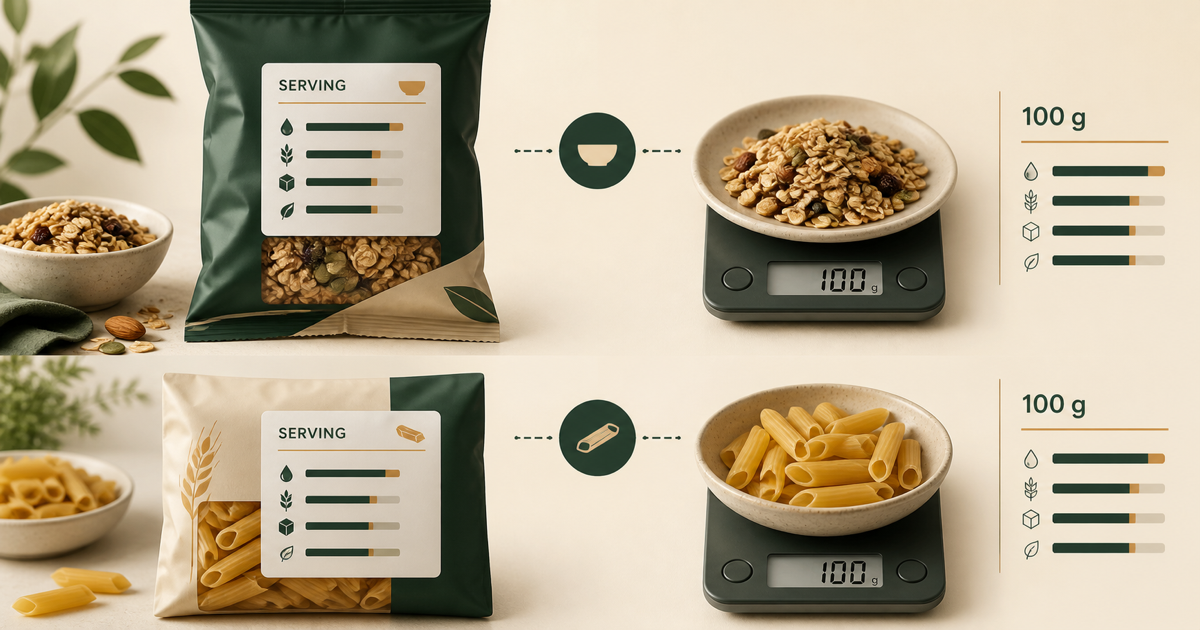
Label basics
Per Serving vs Per 100g: Which Should You Use?
Per serving describes the portion you eat; per 100g describes the food itself. The formula, when each basis is right, and why U.S. labels make you calculate.
Read the guide →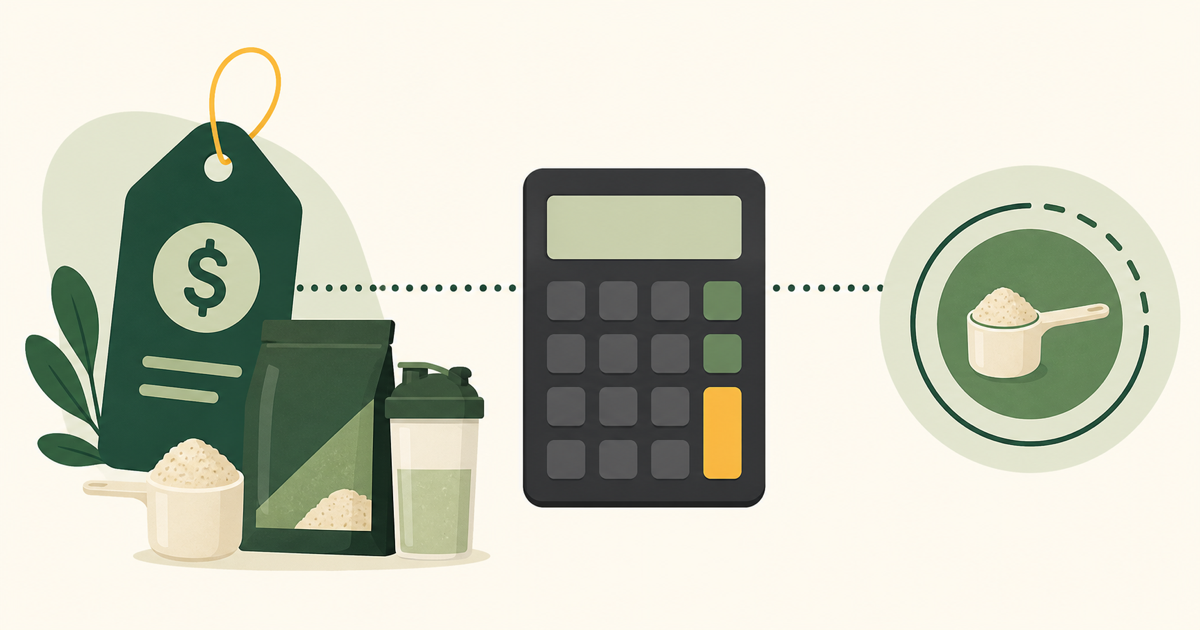
Tool guide
Protein Cost Calculator: Price per 25g
A companion guide to our free protein cost calculator: what to enter, the price-per-25g formula it runs, and how to verify the result by hand.
Read the guide →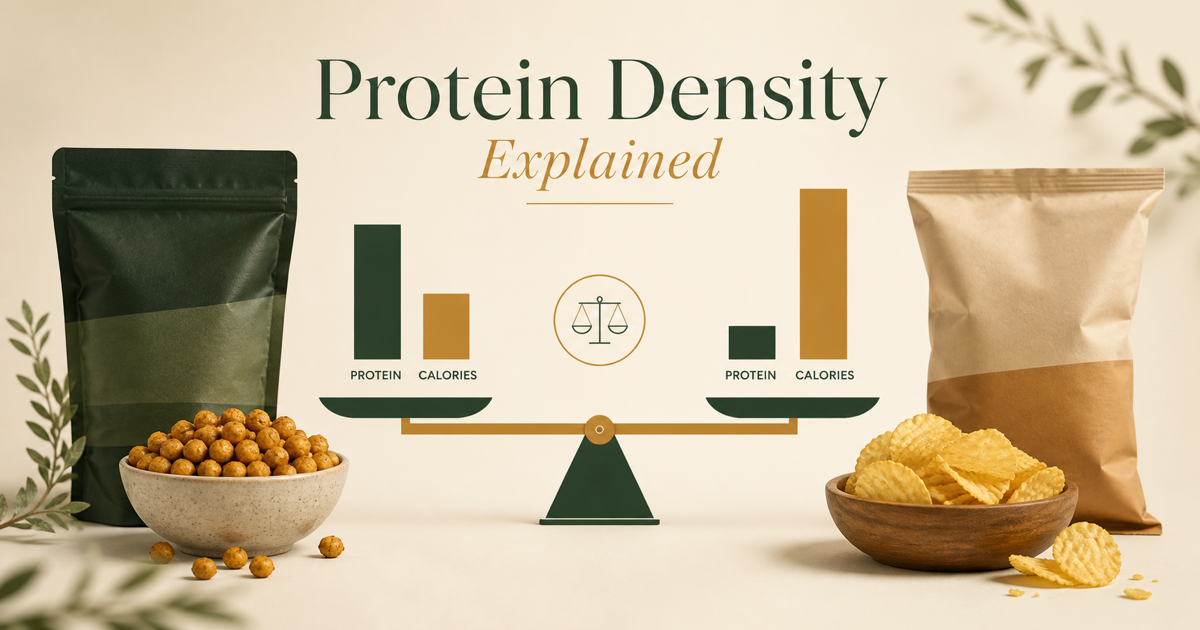
Comparison method
Protein Density Explained: Protein per 100 Calories
Protein density is protein grams per 100 calories. Learn the formula, when it helps, where it misleads, and how it differs from cost per 25g protein.
Read the guide →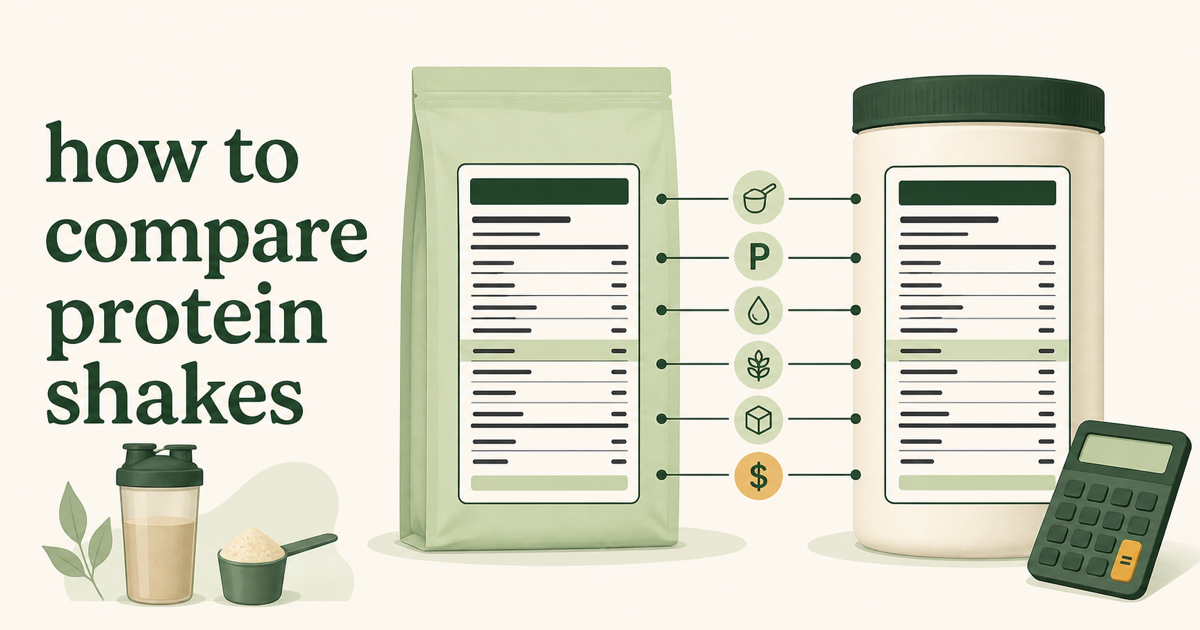
Label basics
Understanding % Daily Value
What % Daily Value means on a U.S. Nutrition Facts label: the 5% low and 20% high rule, why the column never adds to 100%, and which lines have no %DV.
Read the guide →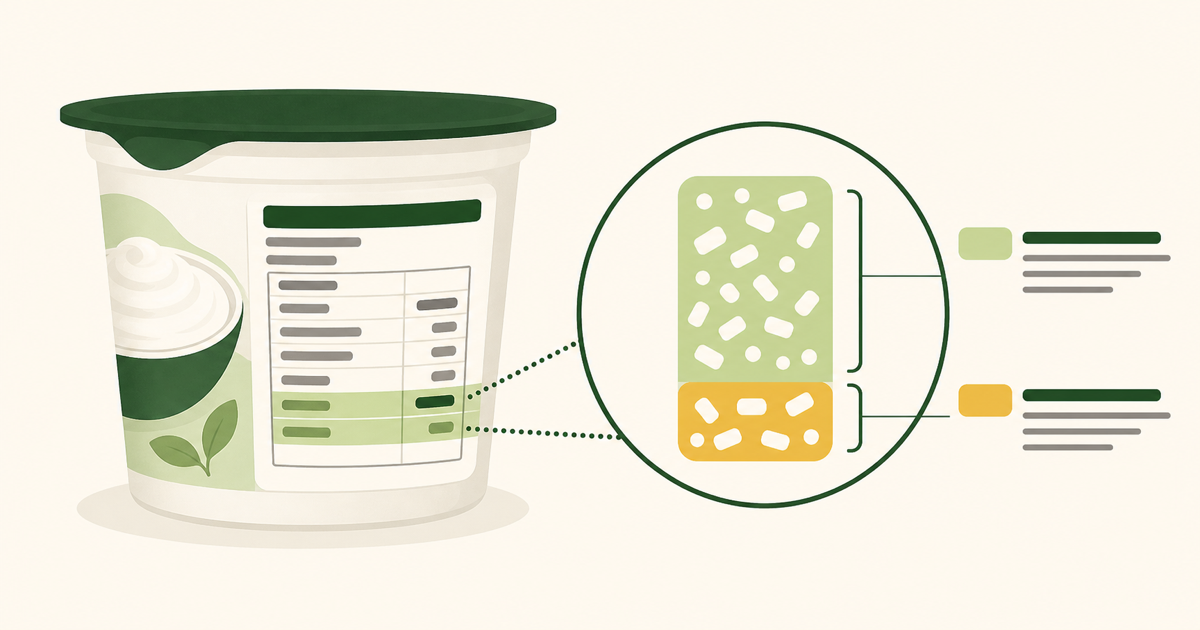
Label basics
What “Includes Added Sugars” Means
How to read the “Includes Xg Added Sugars” line: why it is indented under Total Sugars, how the %DV works from 50g, and the special rule for honey.
Read the guide →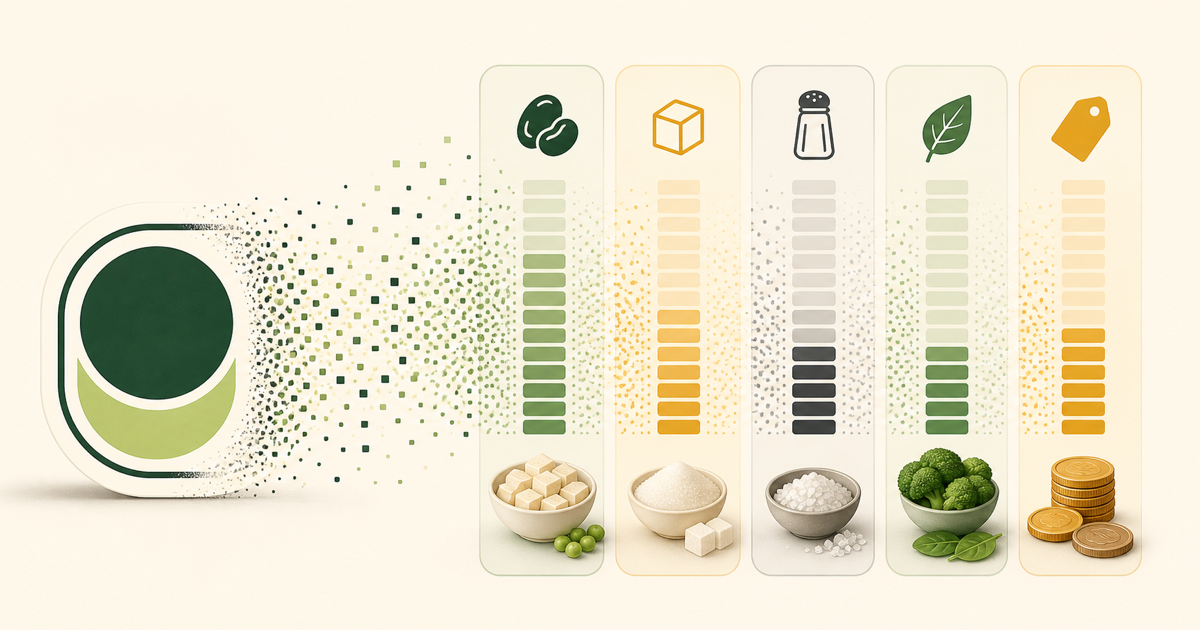
Comparison method
Why Nutrition Scores Can Hide Important Trade-Offs
Nutri-Score, Health Star Rating, and 1–100 app scores compress fixed nutrient weights into one symbol—so opposite nutrition profiles can earn the same grade.
Read the guide →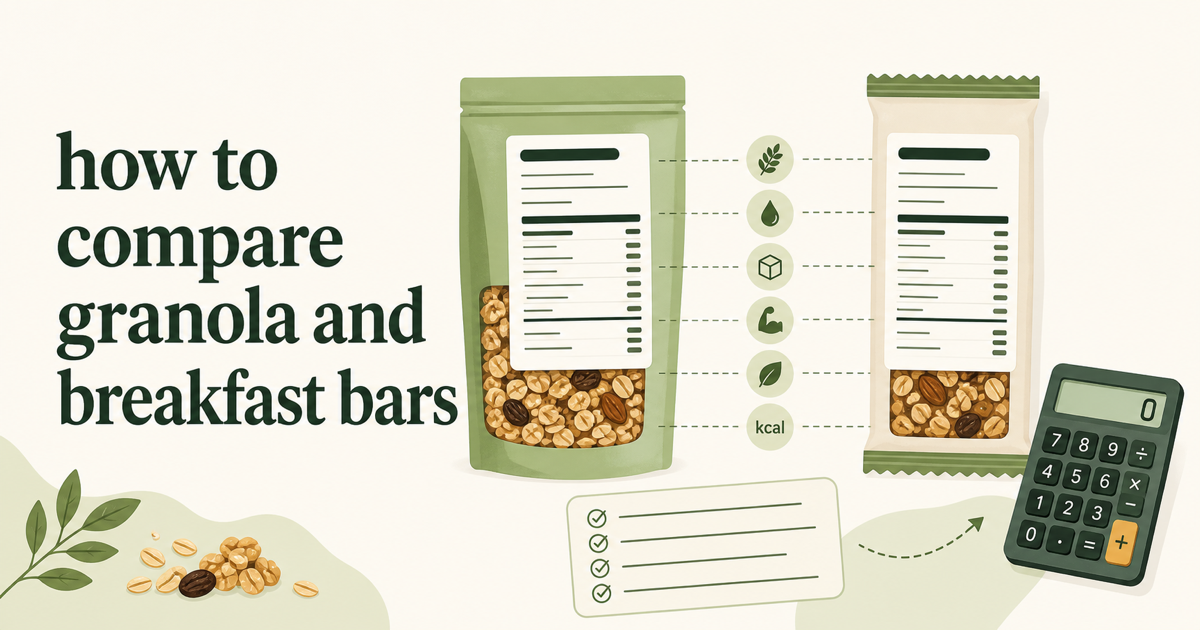
Label basics
Why Packages Have Multiple Servings
Serving sizes follow FDA reference amounts (RACC) for what people typically eat at one sitting — which is why one package can hold several servings.
Read the guide →A clearer way to compare
Take the math to the shelf.
Scan a barcode or nutrition label, compare products on the same target, and keep the trade-off visible in AptBite.